New Features in ggplot2 4.0.0

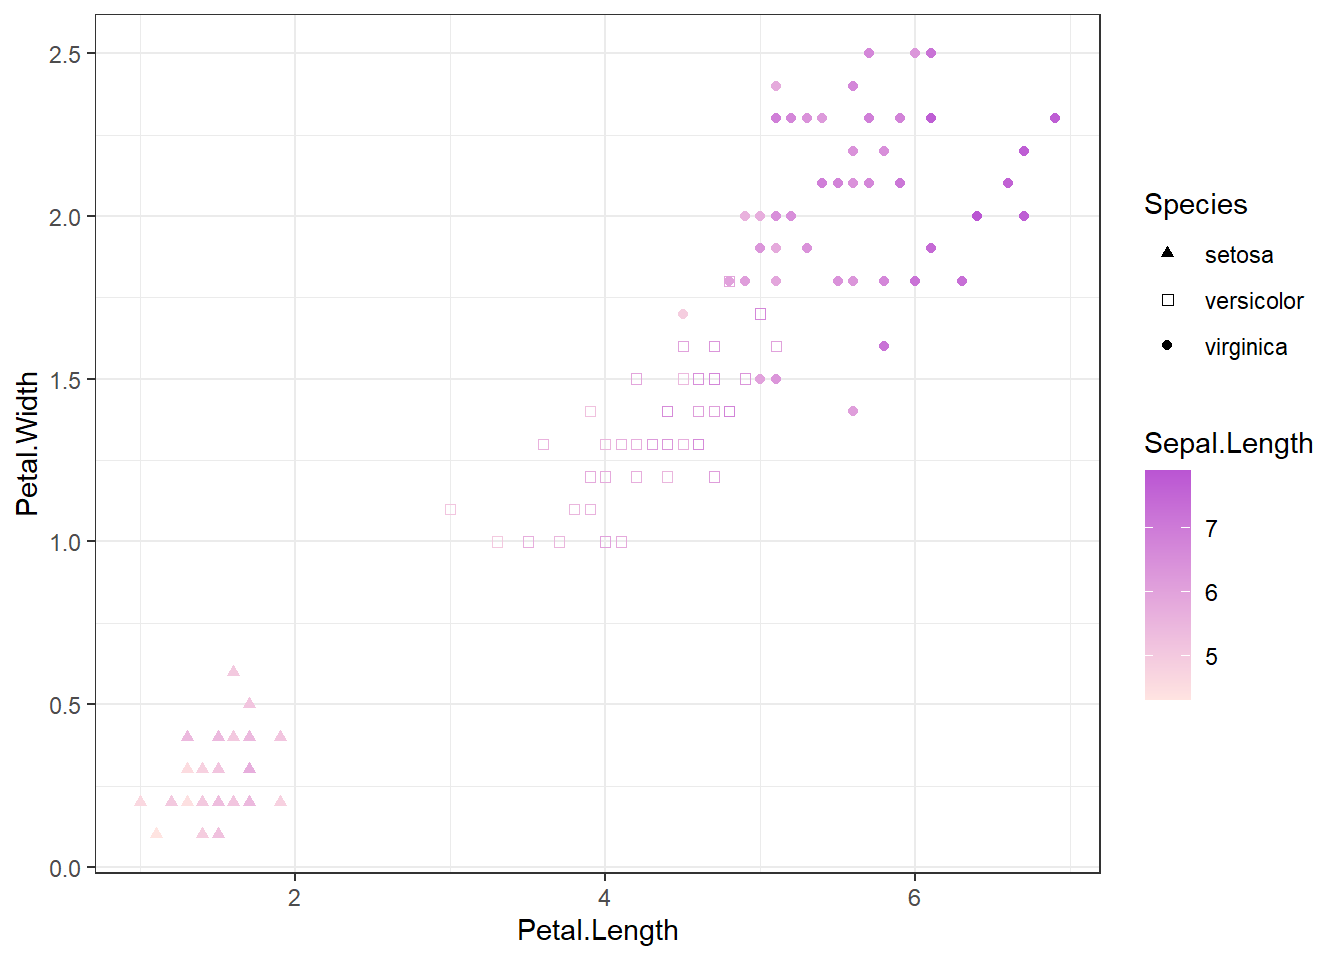
The ggplot2 package recently had a major release that coincided with its 18th anniversary! The ggplot2 4.0.0 release includes dozens of improvements ranging from theme customization and scale enhancements to new geom capabilities. This post highlights a few of the updates that I found particularly useful. Themes Ink and paper Users now have a quick and intuitive way to style plot colors using the paper and ink arguments available in ggplot2 themes.
July 16, 2026

Lessons from Submitting an R Package to CRAN

Note: ratlas was recently archived on CRAN due to a dependency being removed. We’re actively working to get it back, but these submission lessons still apply! Submitting ratlas to CRAN was one of those experiences that makes you a better R developer. There’s a lot of back-and-forth, and each round of feedback teaches you something new about writing clean, considerate package code. Here are the lessons that stuck with me.

June 24, 2026

Predicting Hospital Readmission Using Tidymodels

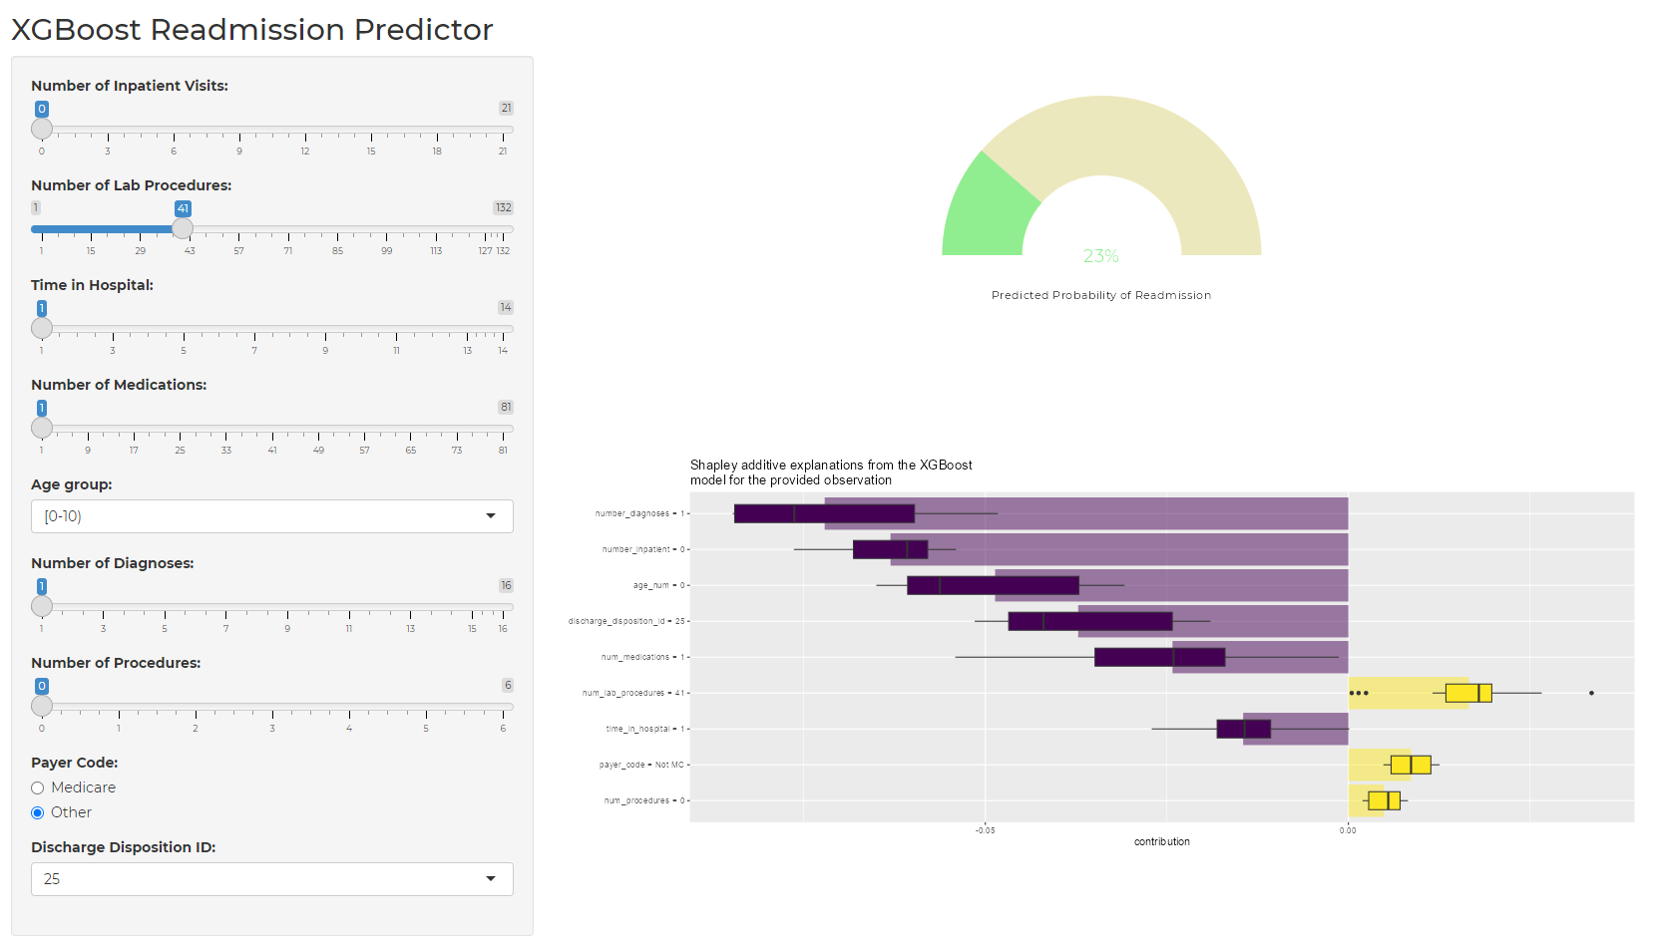
I wanted to share one of my project presentations from the last class of my master’s program, Statistical Learning II. This project involved building a decision support tool using patient record data to predict the probability of hospital readmission. I used Shiny to build my decision support tool which featured an XGBoost model that I constructed using the tidymodels collection of R packages. In the presentation below, I briefly discuss the steps I took while building my decision support tool, including data pre-processing, feature engineering, and model building.

By Noelle Pablo

June 14, 2023

Highlights from rstudio::conf(2022)!

I had the pleasure of attending the 2022 R Studio conference last week in Washington D.C. As always, it was filled with incredible workshops taught by highly esteemed instructors, fascinating presentations from R users all over the globe, and of course, great company! Reunited with my good friend and former professor, Dr. Shannon Pileggi. I wanted to take a moment to reflect on some of the highlights from my experience at the conference:

By Noelle Pablo

August 1, 2022

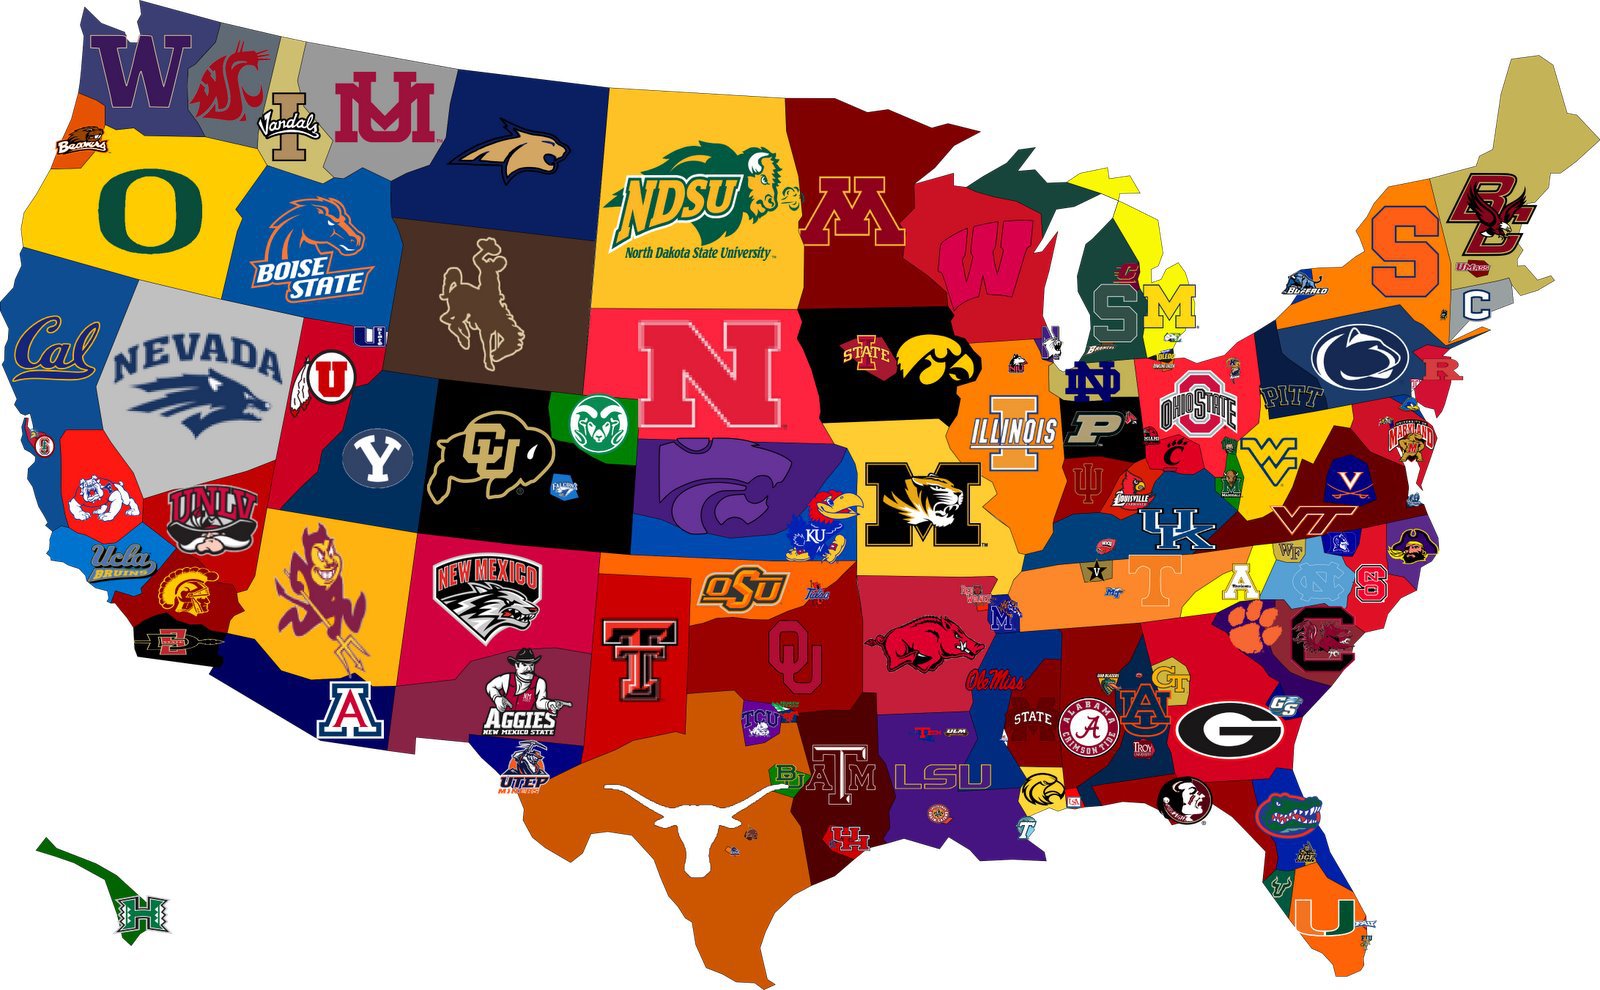
Principal Components Analysis in R: College Sports

Last fall, I took a multivariate statistics course at the University of Kansas as part of the Applied Statistics, Analytics, and Data Science graduate program. One of the topics covered in the course was principal components analysis (PCA). PCA is commonly used when 1. there are a large number of numerical variables in a data set, and 2. the variables are strongly correlated with each other. After conducting a PCA, the correlated variables can be replaced by a smaller number of uncorrelated variables, known as the principal components.

By Noelle Pablo

March 30, 2022